Hello, welcome to Nanjing Longce surveying and Mapping Technology Co., Ltd!
语言选择: ∷ 

Navvis VLX data accuracy case study

Release time:2021-07-14 16:02viewed:times
Navvis VLX data accuracy case study
 
The NAVVIS VLX is a portable device designed specifically for small and medium sized projects, such as steps, narrow rooms and complex environments such as messy construction sites, capable of achieving a high level of accuracy.
 
So how accurate is the data captured by Navvis VLX? Nanjing Longce tests with you to find out what ~
 
When it comes to moving scanning instruments, the global accuracy depends on the project itself, so we cannot make a general statement on this. Instead, we use three different scenarios as case studies to analyze the accuracy:
 
01 Parking lot
Parking lot is an ideal scanning scene for mobile scanning system, because parking lot is open space, which can carry out many "closed loop" scanning.
 
02 Narrow straight corridor
It's built manually, but for a mobile scanning system, it's a very special complex scene, no closed loop.
 
03 Office
This is an office composed of several small rooms connected by a corridor, with additional doors connecting the small rooms, with a moderate degree of complexity. In this environment, we can perform a limited "closed loop" scan.
 
Case Study 1: Parking lot
 
This case is very suitable for mobile scanning: a parking lot with a large area of open space can perform many closed-loop scans.
 

The project scanned an area of approximately 1,500 square meters using Navvis VLX and took 20 minutes to capture 8 control points.
 

In this particular case, we did not capture any panoramic photos, and we processed the data captured by Navvis VLX twice:
 
Data processing twice:
a) Ground control points are only used for calibration, but control point optimization is not carried out;
b) Use ground control points for global point cloud optimization and calibration.
 
a) Point cloud without control point benchmark optimization

b) A point cloud that uses control points for baseline optimization

 
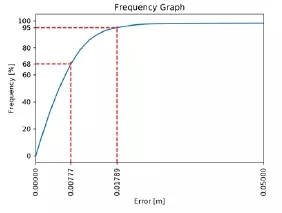
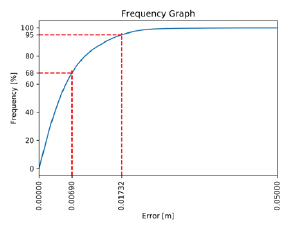
From the analysis shown in the figure below, we can get the absolute accuracy of the detection environment:


a) situation:
Without optimization based on control points, the 68% confidence deviation is 8mm and the 95% confidence deviation is 18mm.
 
b) situation:
After control point optimization, the deviation of 68% confidence is 6mm, and the deviation of 95% confidence is 15mm.


In this specific test scheme, we only used control points as calibration, rather than global point cloud optimization.

Case study 2: Long corridor

The environment of long corridor is very challenging for mobile scanning, so a straight and narrow corridor (about 54×2m) was selected for this experiment.
 
The environment added three control points for scanning, which was done in one go without any closed-loop scanning: starting at one end of the corridor, walking to the other end, and not returning to the starting position.
 
As in the previous case, we processed the obtained data twice:
 
Data processing twice:
c) Only control points are used as calibration and no control point benchmark optimization is carried out;
d) Use control points as global point cloud optimization and calibration.
 
c) Control points are only used for calibration, without reference optimization of control points

d) Use control points as global point cloud optimization and calibration

 
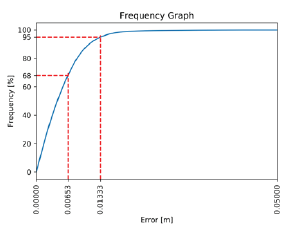
It is worth mentioning that in the condition c), the measurement deviation of absolute accuracy at 95% confidence is 17mm, which is only 4mm higher than that in the condition d). Meanwhile, in c) case, control points are only used for calibration and there is no global point cloud optimization. Therefore, this means that the same accuracy can be achieved without using control points in a long corridor environment.


Case Study 3: Office

This example represents the typical layout of a medium-sized office or residential project -- small rooms arranged along a corridor and connected by several additional doors.

The project is approximately 460 square meters and is scanned with a data set completed in 30 minutes. No control points were used in this project, but we did some closed-loop scanning in the possible areas. At intervals of 1-2 meters, the scanning equipment captured panoramic images, which helped to create a highly simulated shading of the point cloud.
 

As a baseline for this case, a CAD model was generated using a high precision total station connected to a CAD system.
 
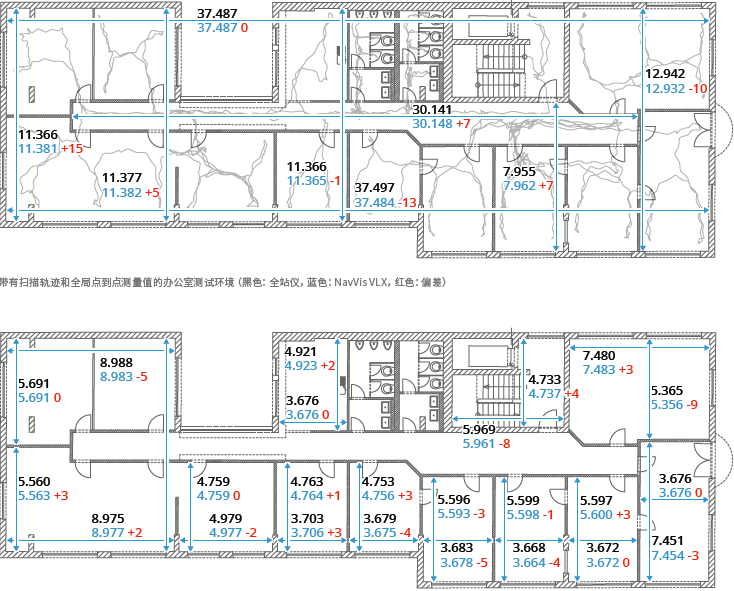
To make a comparison, we manually made measurements in the CAD model (black numbers below) and compared the results with the magnitude values in the Navvis VLX point cloud (blue numbers below) to record the deviations of the two sets of data. The red data below represents the errors in the Navvis VLX point cloud. Please refer to the table below for detailed data.
 

In this case, only one of the 24 measurement points had an error greater than 8mm, and none of the absolute measurements had an error greater than 15mm. The relative accuracy of the measurements appears to be higher than the figures indicated in the product manual (68% confidence deviation less than 8mm).
 
However, due to the error-prone process of manual measurement in the point cloud and CAD model, this total station-based assessment is less reliable than the global point-to-point cloud index. Even so, this test provides a good reference when it comes to a layout consisting of small rooms.


龙测三维-三维扫描仪-3D扫描服务-FARO法如Sweep WeChat yards pay attention to us

  • Quotation and presentation requestliuchunlei@longce.net

  • The mobile phone+86 13851969931

Nanjing Longce Measurement Technology Co., Ltd  Address:No.15 Xinghuo Road, Jiangbei new district, Nanjing,China. ICP:苏ICP备20044645号-1